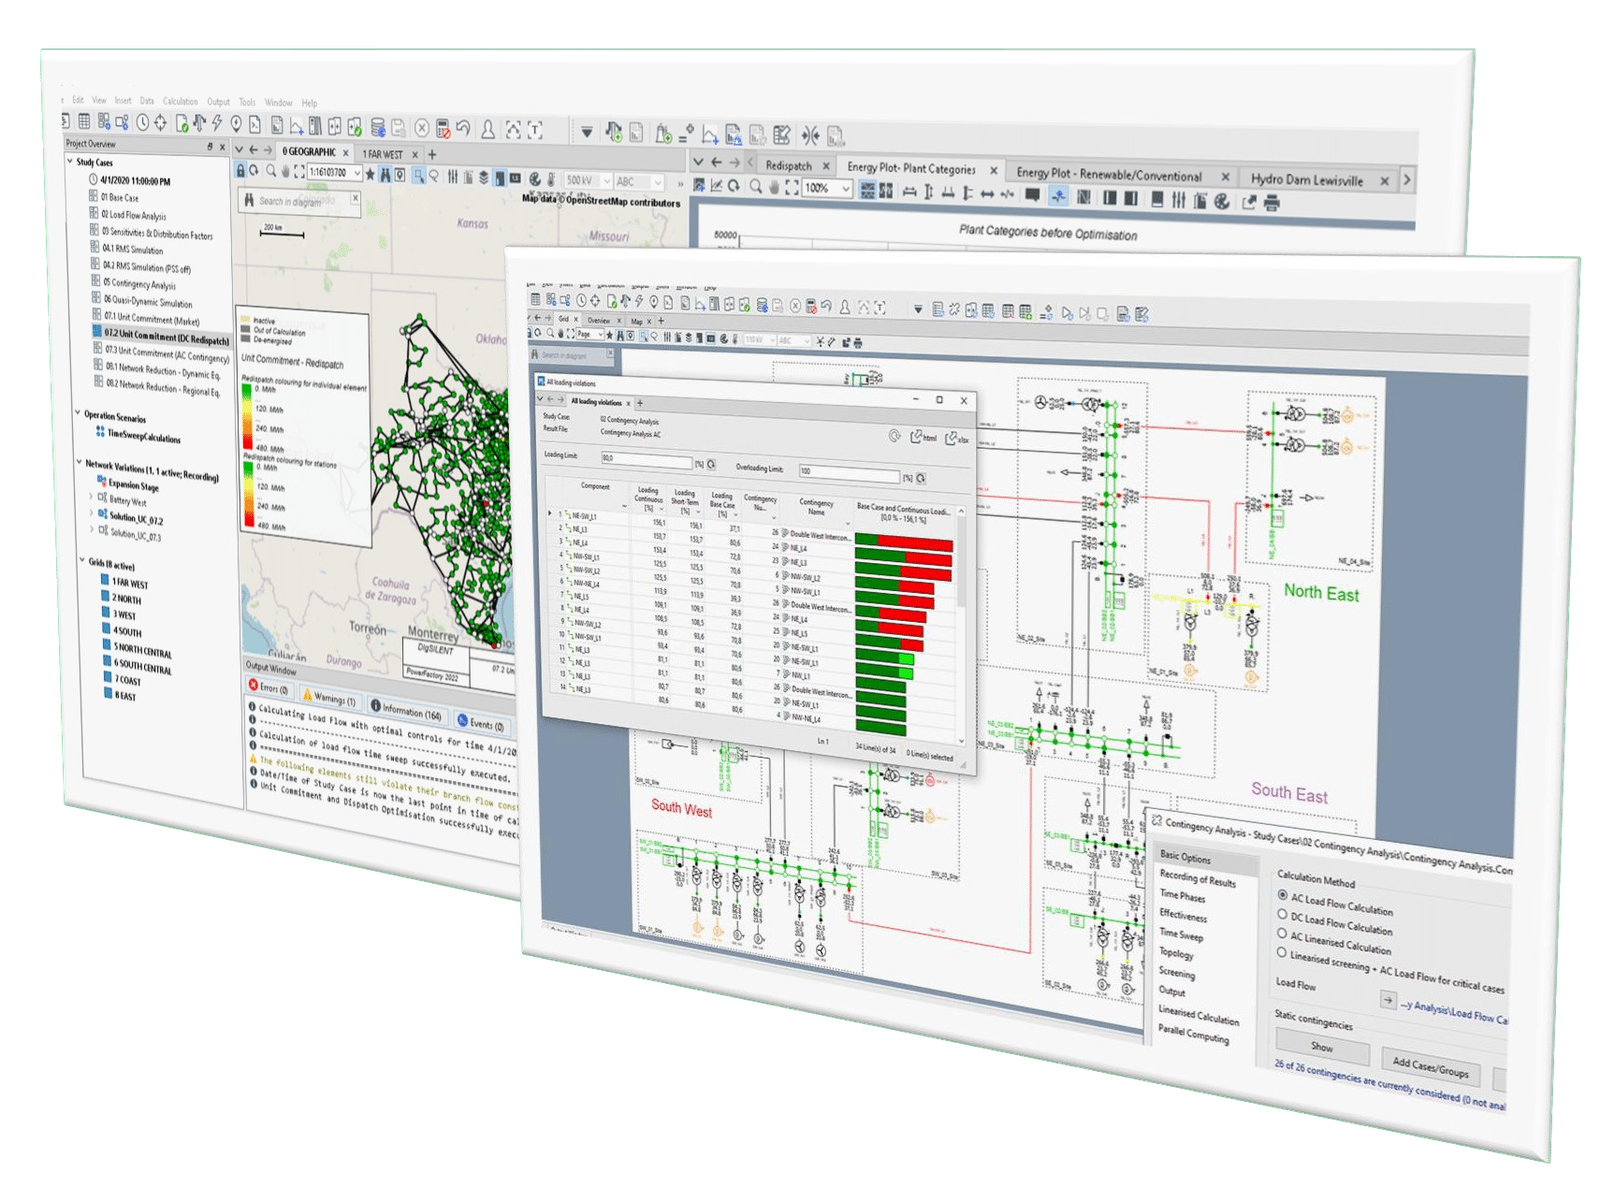
Spanish Grid Curtailment Map
Explore our interactive map to find a 2 year-ahead technical restrictions curtailment estimate of the Spanish network nodes updated semiannually. A map that will help you reduce the effort required to find the best available nodes for agile decision making.
The intention of this tool is to facilitate informed decisions to the general public and for market agents to have a small hint of where the market can head in the different nodes of the Spanish geography.
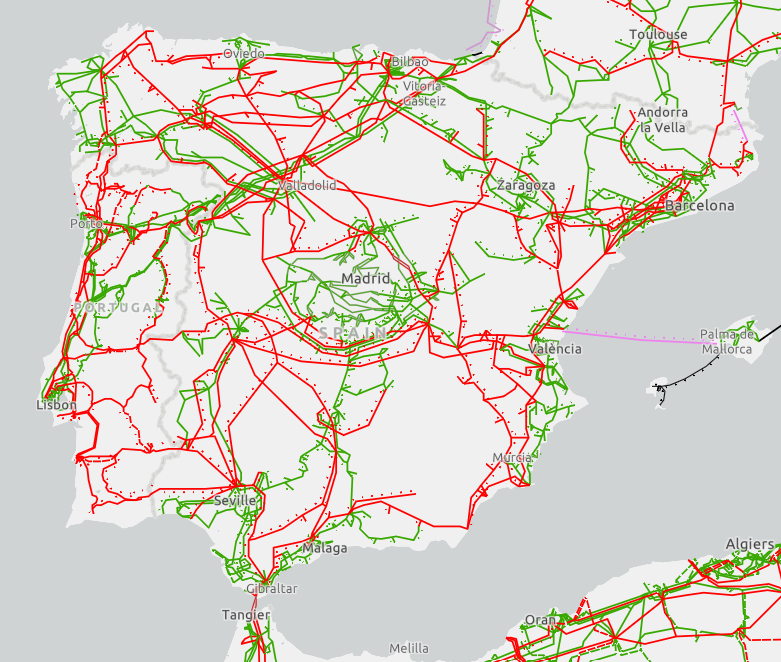
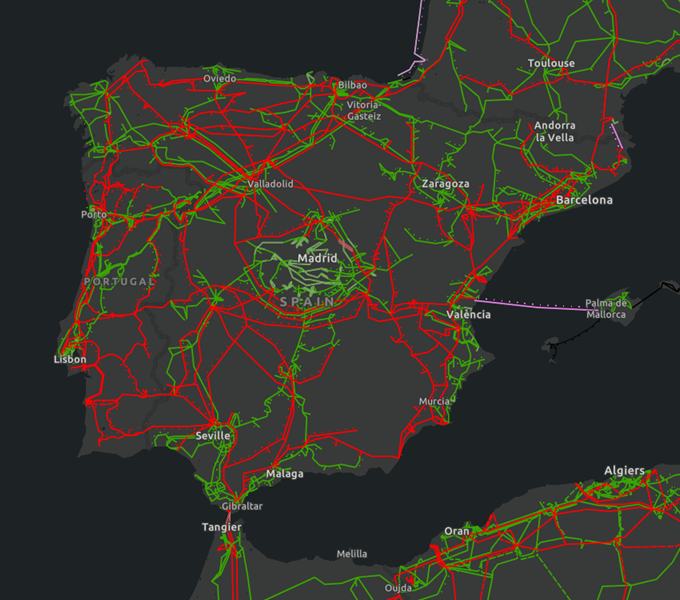
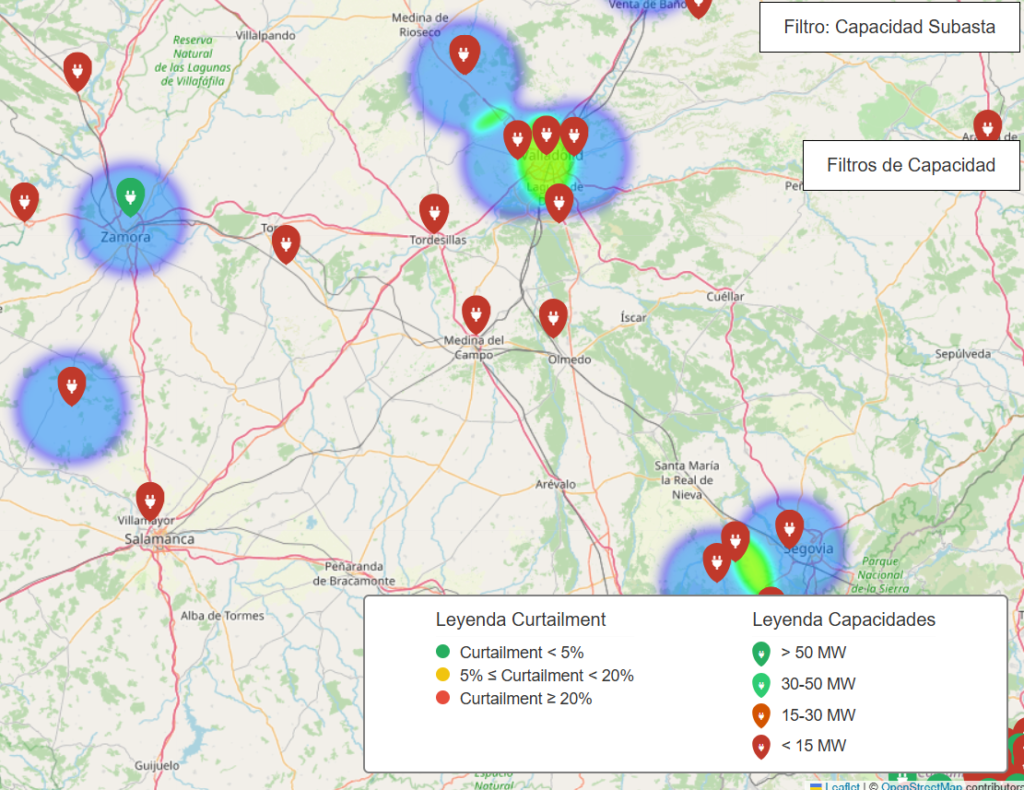
Interactive map with all the substations in Spain using a color coding to indicate the capacity of the node. The map discriminates between generation capacity for MPE and batteries.
Discover all the information related to capacity availability in the transmission and distribution grid nodes to connect generation in an interactive and dynamic map
The map is updated every first week of the month you will receive the updated map with the data published by DSOs and Red Eléctrica
OUR APPROACH